
 Image 1 of 3
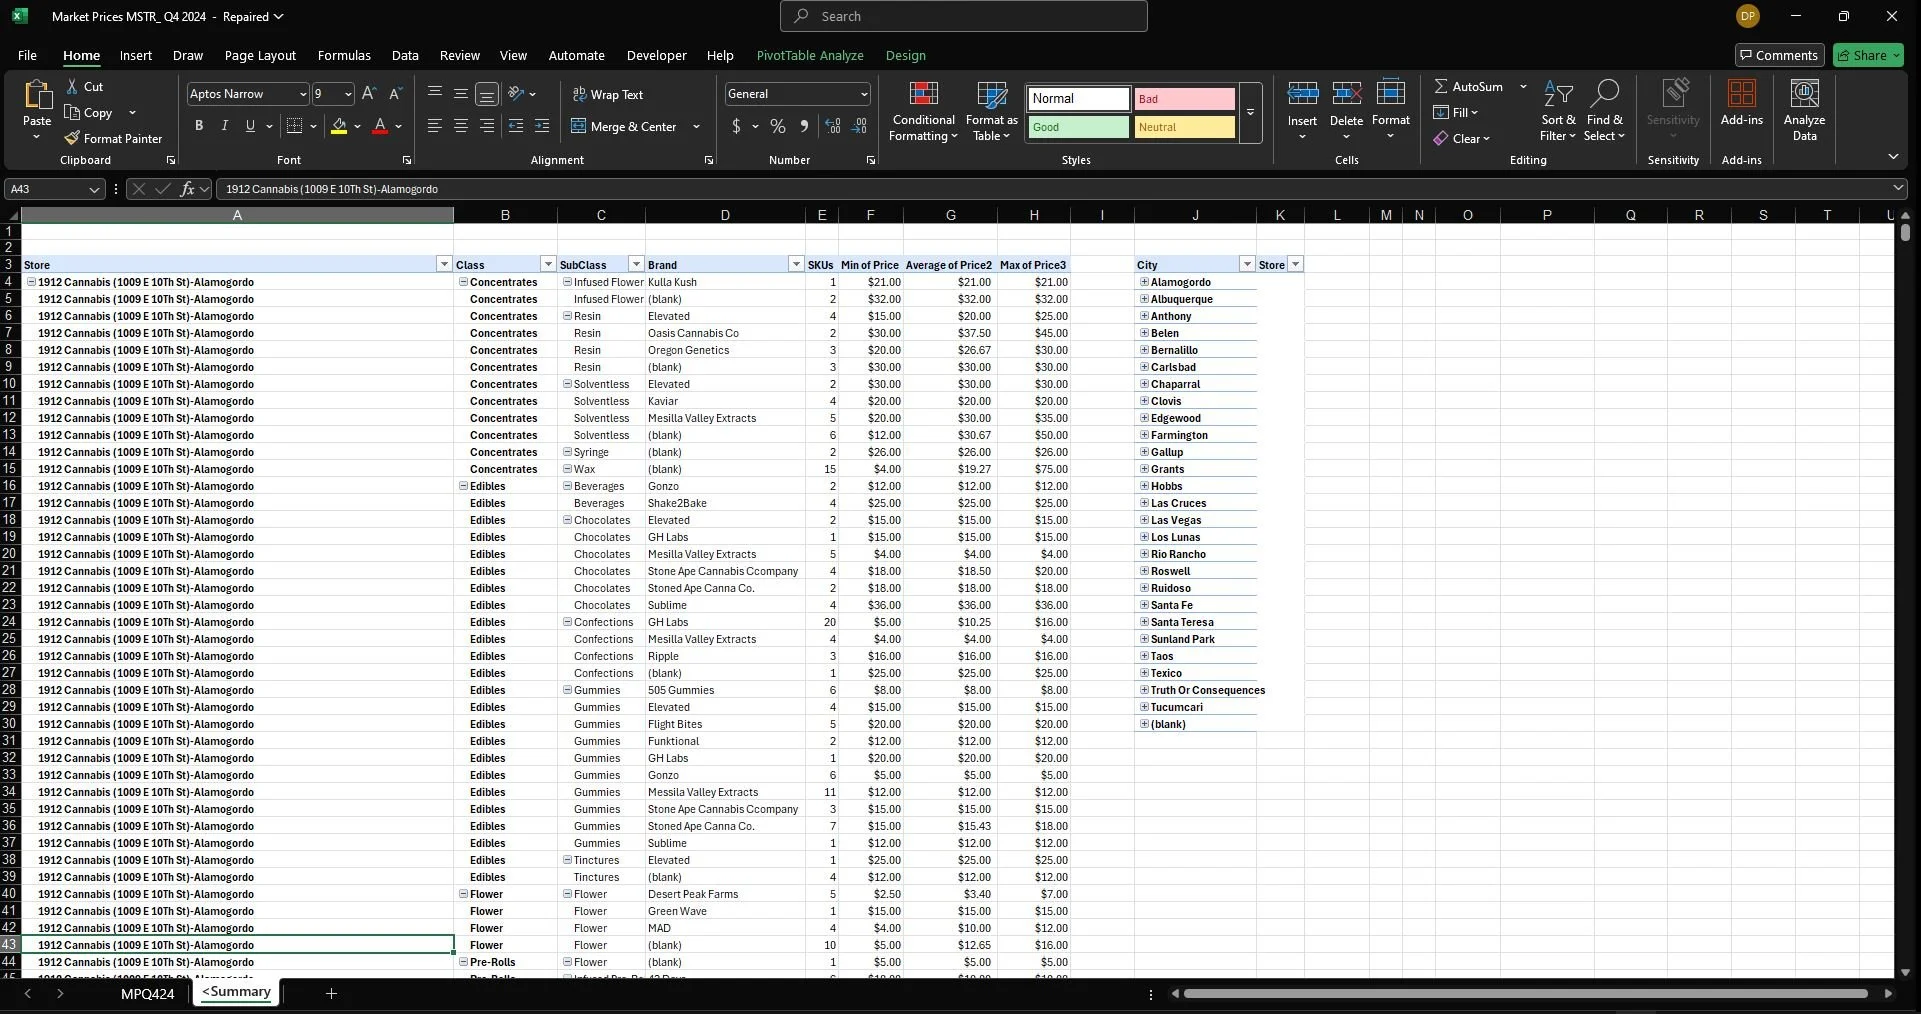 Image 2 of 3
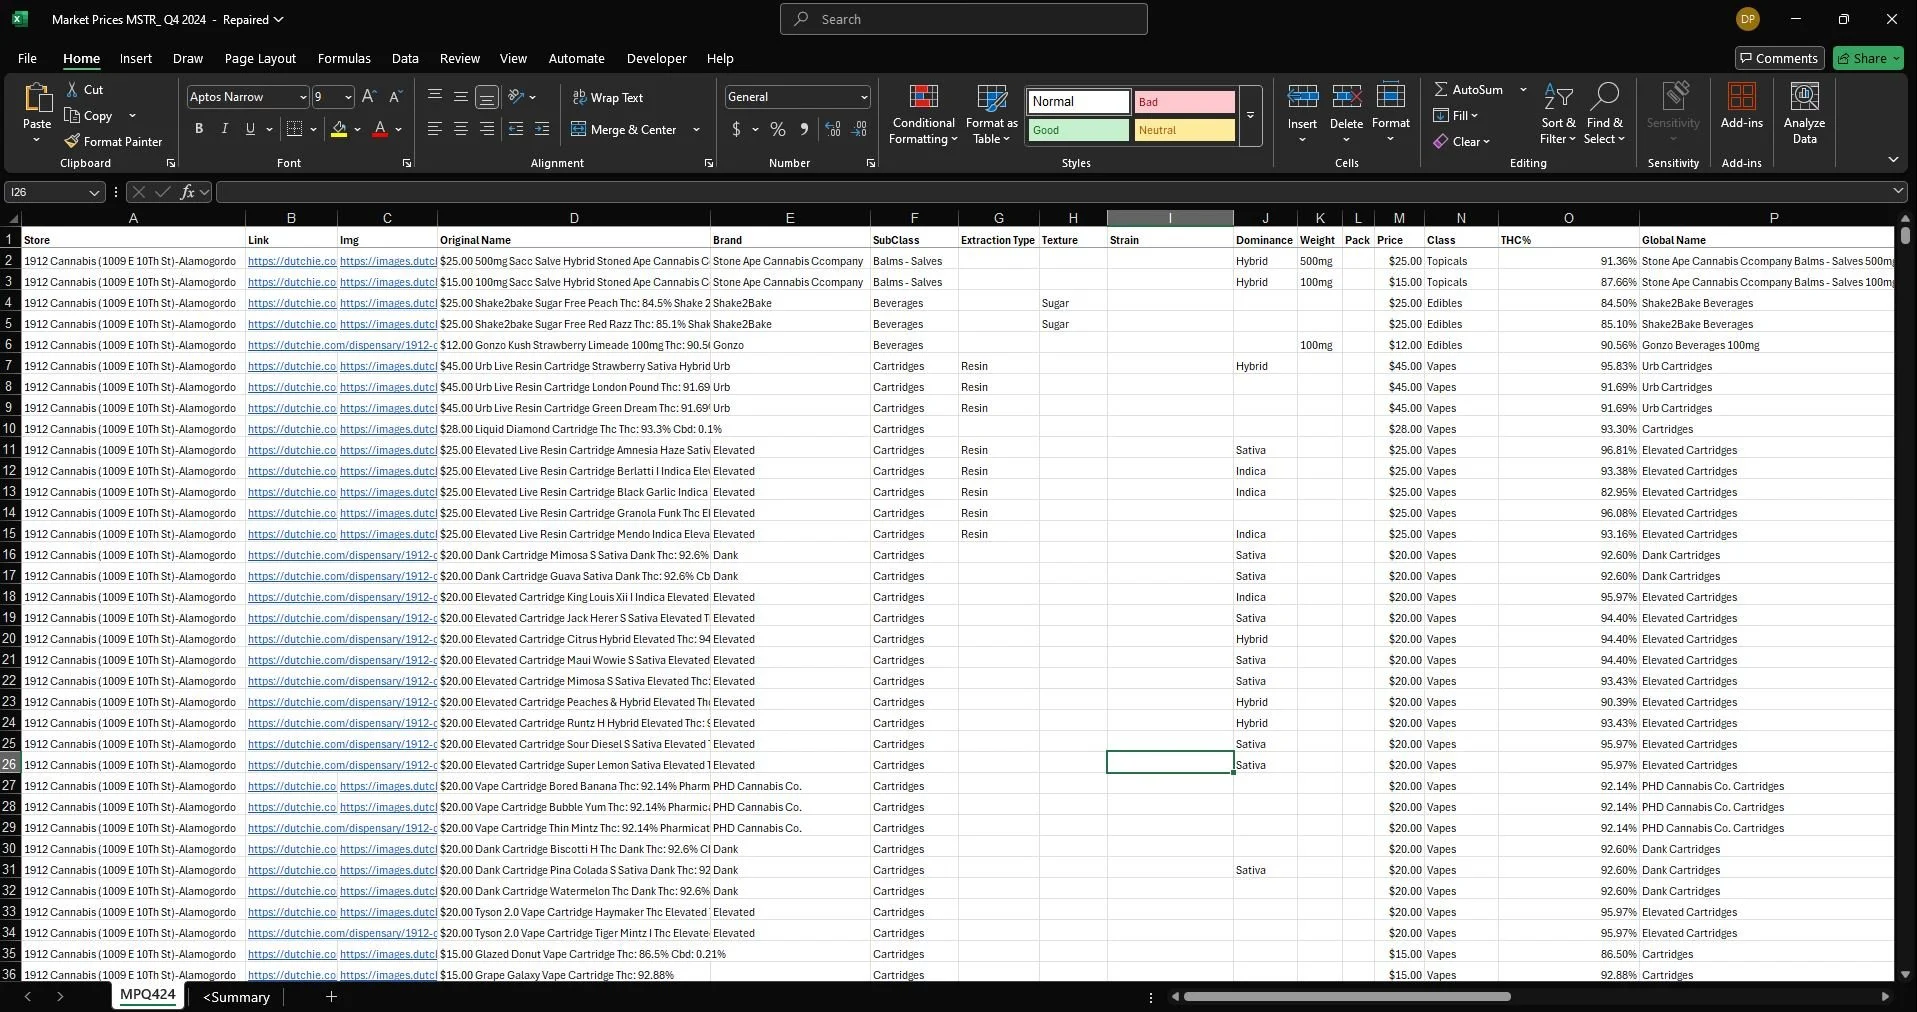 Image 3 of 3
A complete snapshot of the New Mexico cannabis market.
This isn’t just another spreadsheet—it’s a tool built for clarity in a crowded market. Inside, you’ll find 339 stores across 26 cities in New Mexico, with every menu item scraped, cleaned, and organized into a master dataset. The file includes both the raw data (down to the product level: brand, strain, dominance, class, subclass, price, THC%) and a pivot table summary that makes it easy to see trends at a glance.
Competitive Analysis – See how your store’s pricing stacks up against hundreds of competitors.
Category Insights – Drill into averages and ranges by class (flower, vapes, concentrates, edibles, etc.) to guide smarter buying and promotions.
City-Level Breakdown – Compare pricing across 26 different cities in NM and spot regional opportunities.
Vendor Negotiations – Use real data to negotiate better wholesale prices and avoid overpaying.
Menu Strategy – Identify gaps or over-saturated categories before making inventory decisions.
Trend Tracking – Compare Q4 prices with future quarters to track market shifts over time.
In cannabis, guesswork is expensive. Whether you’re a dispensary owner, buyer, brand rep, or consultant, this file saves you the hours it would take to gather and normalize this data yourself. Instead of chasing scattered menu links, you get a ready-to-use master view of the market—clean, organized, and built to help you make decisions with confidence.